Amortization Schedule Explained: What Every Row Means
Learn how to read an amortization schedule row by row — what each column means, how balances change monthly, and how to use a schedule to plan loan payoff.
- amortization schedule
- loan amortization table
- how to read amortization schedule
- mortgage schedule
- loan payoff
This article is for educational purposes only. It does not constitute financial or legal advice. Consult a licensed financial professional or HUD-approved housing counselor before making mortgage decisions.
An amortization schedule is a complete table of every loan payment from the first month to the last. It shows how each dollar is allocated, how the balance declines, and — if you know how to read it — exactly how much of your loan you have paid off at any point in time.
Most borrowers never look at their amortization schedule. Those who do are far better positioned to make informed decisions about extra payments, refinancing, and the real cost of their loan.
The Five Standard Columns
A standard amortization schedule contains five columns:
| Column | What It Shows |
|---|---|
| Payment # | Sequential payment number (Month 1, Month 2, etc.) |
| Payment Amount | Total amount due that period (fixed for a fixed-rate loan) |
| Interest Paid | Portion of that payment covering interest charges |
| Principal Paid | Portion that reduces the outstanding balance |
| Remaining Balance | Outstanding loan balance after this payment is applied |
Some schedules also include cumulative totals — cumulative interest paid and cumulative principal paid — which help you see at a glance how much of the total loan cost you have covered at any point.
How Each Row Is Calculated
Every row in an amortization schedule is computed from the previous row’s balance using two formulas:
Step 1 — Calculate this month’s interest:
Interest = Remaining Balance × (Annual Rate ÷ 12)
Step 2 — Calculate this month’s principal:
Principal = Total Payment − Interest
Step 3 — Update the balance:
New Balance = Previous Balance − Principal Paid
The total payment stays the same every month (for a fixed-rate loan). The balance drops by the principal amount. The new balance is fed into next month’s interest calculation. Repeat 360 times for a 30-year mortgage.
A Complete Example: $250,000 at 6.0% Over 30 Years
Note: 6.0% is used here as an illustrative example only. Actual mortgage rates depend on market conditions, loan type, credit profile, and other factors.
Using the amortization formula, the fixed monthly payment is $1,498.88.
First 12 Months
| # | Payment | Interest | Principal | Balance |
|---|---|---|---|---|
| 1 | $1,498.88 | $1,250.00 | $248.88 | $249,751.12 |
| 2 | $1,498.88 | $1,248.76 | $250.12 | $249,501.00 |
| 3 | $1,498.88 | $1,247.51 | $251.37 | $249,249.63 |
| 4 | $1,498.88 | $1,246.25 | $252.63 | $248,997.00 |
| 5 | $1,498.88 | $1,244.99 | $253.89 | $248,743.11 |
| 6 | $1,498.88 | $1,243.72 | $255.16 | $248,487.95 |
| 7 | $1,498.88 | $1,242.44 | $256.44 | $248,231.51 |
| 8 | $1,498.88 | $1,241.16 | $257.72 | $247,973.79 |
| 9 | $1,498.88 | $1,239.87 | $259.01 | $247,714.78 |
| 10 | $1,498.88 | $1,238.57 | $260.31 | $247,454.47 |
| 11 | $1,498.88 | $1,237.27 | $261.61 | $247,192.86 |
| 12 | $1,498.88 | $1,235.96 | $262.92 | $246,929.94 |
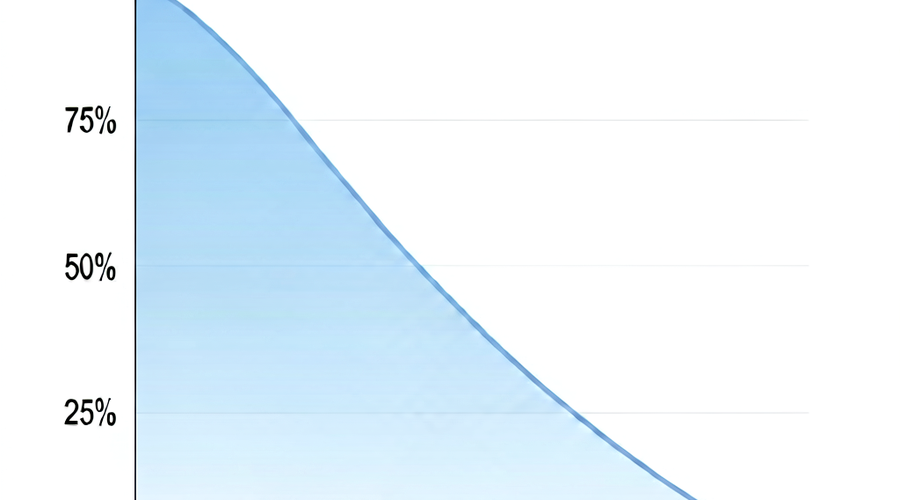
Year 1 summary: You paid $17,986.56 in total. Of that, $14,916.50 was interest (83%) and only $3,070.06 reduced the principal (17%). After 12 payments, your balance has dropped from $250,000 to $246,929.94 — a reduction of just $3,070.
Mid-Loan Snapshot (Year 15, Payments 169–174)
By Year 15, the outstanding balance has fallen to approximately $172,500.
| # | Payment | Interest | Principal | Balance |
|---|---|---|---|---|
| 169 | $1,498.88 | $862.45 | $636.43 | $172,004.19 |
| 170 | $1,498.88 | $860.02 | $638.86 | $171,365.33 |
| 171 | $1,498.88 | $856.83 | $642.05 | $170,723.28 |
| 172 | $1,498.88 | $853.62 | $645.26 | $170,078.02 |
| 173 | $1,498.88 | $850.39 | $648.49 | $169,429.53 |
| 174 | $1,498.88 | $847.15 | $651.73 | $168,777.80 |
Figures are approximate and illustrative.
At Year 15, approximately 57% of each payment still goes to interest — but the situation has improved from 83% at the start.
Final Payments (Year 30, Payments 355–360)
| # | Payment | Interest | Principal | Balance |
|---|---|---|---|---|
| 355 | $1,498.88 | $36.94 | $1,461.94 | $5,928.43 |
| 356 | $1,498.88 | $29.64 | $1,469.24 | $4,459.19 |
| 357 | $1,498.88 | $22.30 | $1,476.58 | $2,982.61 |
| 358 | $1,498.88 | $14.91 | $1,483.97 | $1,498.64 |
| 359 | $1,498.88 | $7.49 | $1,491.39 | $7.25 |
| 360 | $7.29 | $0.04 | $7.25 | $0.00 |
Final payment adjusted to clear exact balance; figures are approximate.
In the last year, almost every dollar is principal. The loan terminates at exactly $0.00.
Total interest paid over 30 years: approximately $289,593 on a $250,000 loan.
How to Use an Amortization Schedule Strategically
Verify Your Loan Servicer’s Statements
Each month your mortgage servicer sends a statement showing how your payment was applied. Cross-reference the interest and principal figures against your amortization schedule. Discrepancies could indicate calculation errors or misapplied payments.
The CFPB recommends borrowers review their mortgage statements regularly and contact their servicer in writing if they believe payments are not being applied correctly. (CFPB — Mortgage Closing)
Identify Your Equity Position at Any Point
To find your loan-to-value (LTV) ratio at any point in time, look up your balance in the schedule and divide it by your home’s current estimated value. This is useful for:
- Determining when you can request PMI removal (typically at 80% LTV)
- Estimating available equity for a HELOC
- Assessing whether refinancing makes financial sense
Find the Crossover Point
The crossover point is the payment number where principal paid first exceeds interest paid in a single payment. On a 30-year, 6.0% mortgage, this occurs around Month 253 — roughly Year 21.
Knowing your crossover point helps you understand when the loan’s value proposition changes: before it, you are primarily paying for the privilege of having the money; after it, you are primarily reclaiming ownership of your home.
Model the Impact of Extra Payments
An amortization schedule shows you the baseline: what happens if you pay exactly the scheduled amount each month. When you add extra principal payments, the schedule compresses. The balance falls faster, future interest charges drop, and the loan terminates earlier.
You can model any extra payment scenario — monthly additions, annual lump sums, or bi-weekly payment structures — using our amortization calculator. It generates a revised schedule showing your new payoff date and total interest saved.
Annual Amortization Summaries
Some lenders and tools provide yearly summaries rather than month-by-month rows. These are useful for tax planning, since mortgage interest paid during a tax year may be deductible for some borrowers. The annual summary shows total interest and total principal paid in each calendar year.
HUD-approved housing counselors can help borrowers interpret their amortization schedules and assess the financial implications of various payoff strategies. (HUD)
Where to Get Your Amortization Schedule
You have several options:
- Our amortization calculator — enter your loan amount, rate, and term to generate a complete schedule instantly at amortcalc.io
- Your lender or servicer — most will provide a schedule on request; some servicer portals include it online
- Your Loan Estimate or Closing Disclosure — federal law requires lenders to provide these documents with key payment information, though they do not include the full monthly schedule
Understanding your amortization schedule is one of the most practical steps you can take as a mortgage borrower. The numbers are not complex once you see the structure — and the insights they reveal can save you significant money over the life of your loan.