15-Year vs. 30-Year Mortgage: Amortization Differences and Trade-offs
15-year and 30-year mortgages amortize very differently. Compare total interest, monthly payments, equity buildup, and which term fits different financial situations.
- 15-year vs 30-year mortgage
- mortgage term comparison
- mortgage amortization
- 15 year mortgage
- 30 year mortgage
This article is for educational purposes only. It does not constitute financial or legal advice. Consult a licensed financial professional or HUD-approved housing counselor before making mortgage decisions.
The choice between a 15-year and a 30-year mortgage is one of the most consequential financial decisions a homebuyer makes — and it is fundamentally a question of amortization. The two loan types amortize differently in almost every way: monthly payment size, interest rate, rate of equity buildup, total interest paid, and financial flexibility.
This article breaks down the differences with concrete numbers so you can evaluate which structure fits your financial situation.
Note: All interest rates used below are illustrative examples. Actual rates depend on market conditions, credit score, down payment, lender, and loan type. Check Freddie Mac’s Primary Mortgage Market Survey for current benchmark rates.
The Basic Arithmetic: Same Loan, Two Terms
Loan amount: $350,000 Assumed rate — 30-year: 7.00% Assumed rate — 15-year: 6.50% (15-year rates are typically lower; this spread is illustrative)
| 30-Year | 15-Year | |
|---|---|---|
| Monthly Payment | $2,328.51 | $3,050.44 |
| Total Payments | 360 | 180 |
| Total Paid | $838,263.60 | $549,079.20 |
| Total Interest | $488,263.60 | $199,079.20 |
| Interest Savings (15-yr) | — | $289,184.40 |
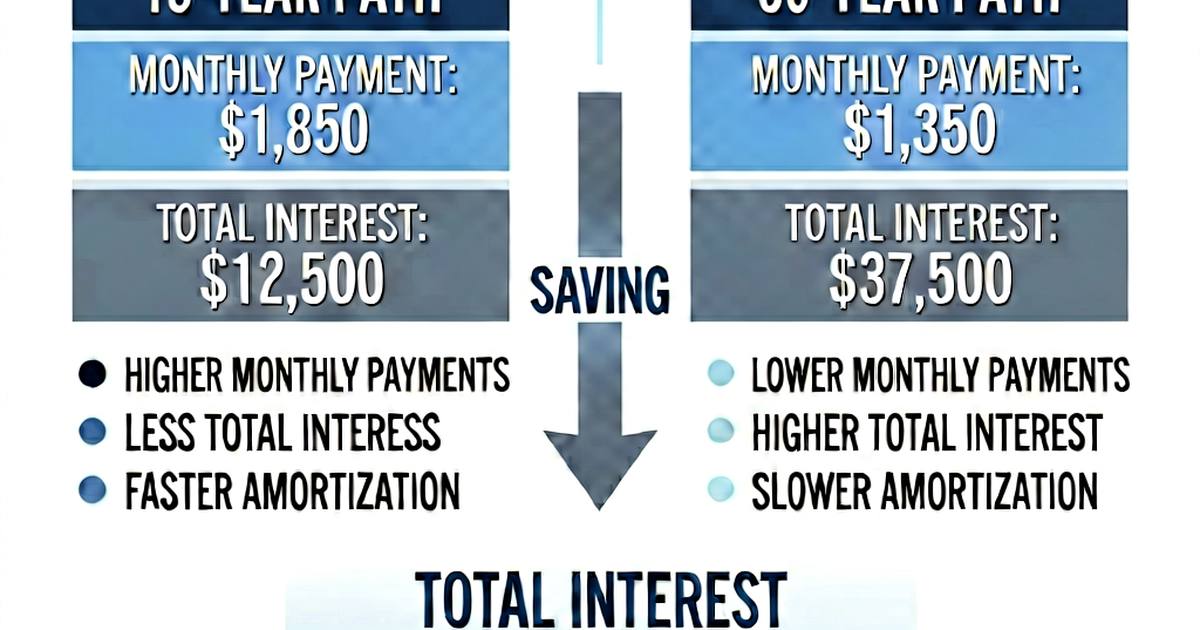
The 15-year mortgage saves nearly $289,000 in interest on a $350,000 loan. The monthly payment is higher by approximately $722 per month.
This is the core trade-off: pay more each month, pay dramatically less overall.
Why the Interest Savings Are So Large
The difference in total interest is not simply a function of making payments for half as long. It results from three compounding factors:
1. A lower interest rate. Lenders typically offer lower rates on 15-year mortgages because the shorter term reduces their exposure to interest rate risk and default risk. As Freddie Mac’s Primary Mortgage Market Survey consistently shows, 15-year fixed rates have historically run 0.5 to 0.75 percentage points below 30-year fixed rates.
2. Faster principal reduction. Because the same loan amount amortizes over half the time, the principal balance decreases much more rapidly. A lower balance each month means less interest each month.
3. Fewer months of accrual. There are 180 fewer payment periods over which interest can accumulate. Even at the same rate, 180 fewer months would produce roughly half the total interest — the lower rate compounds that benefit further.
Amortization Schedule Comparison: Early Months
Using the rates above, here is how Month 1 looks for each option:
| 30-Year | 15-Year | |
|---|---|---|
| Payment | $2,328.51 | $3,050.44 |
| Interest (Month 1) | $2,041.67 | $1,895.83 |
| Principal (Month 1) | $286.84 | $1,154.61 |
| % Going to Principal | 12.3% | 37.9% |
On the 30-year, only 12 cents of every dollar goes to principal in Month 1. On the 15-year, nearly 38 cents does. The equity-building advantage of the 15-year is immediate and substantial.
Equity Buildup: A Five-Year Snapshot
Faster principal reduction means faster equity accumulation — important for financial flexibility, PMI removal, and refinancing options.
Outstanding balance after 5 years (60 payments) on a $350,000 loan:
| Loan Type | Balance After 5 Years | Equity Gained* |
|---|---|---|
| 30-Year (7.00%) | ~$330,800 | ~$19,200 |
| 15-Year (6.50%) | ~$279,400 | ~$70,600 |
Equity gained through paydown only, excluding any home value appreciation.
After five years, the 15-year borrower has paid down nearly $70,600 in principal versus approximately $19,200 for the 30-year borrower — nearly four times more equity through loan paydown alone.
This has practical consequences: the 15-year borrower is far more likely to have reached 20% equity to eliminate private mortgage insurance (PMI), and has a much stronger equity position if they need to sell or refinance.
The Monthly Payment Hurdle
The single largest objection to the 15-year mortgage is the higher monthly payment. On this $350,000 example, the 15-year payment is $722 per month higher than the 30-year payment.
For many borrowers, this is a genuine constraint, not a preference:
- A household qualifying for the 30-year payment may not qualify for the 15-year payment under their lender’s debt-to-income (DTI) requirements
- Higher monthly obligations reduce financial flexibility for emergencies, job loss, or other financial shocks
- That $722 per month invested elsewhere (retirement accounts, other debt payoff) may produce returns that compete with mortgage interest savings
The CFPB notes that choosing a longer loan term in exchange for a lower payment can help borrowers manage their overall debt load and maintain flexibility. (CFPB — 15-Year vs. 30-Year)
The “30-Year With Extra Payments” Strategy
A common approach is to take a 30-year mortgage — securing the lower required payment — but voluntarily make extra principal payments to accelerate payoff.
Advantages:
- Lower required payment preserves cash flow flexibility
- You can slow or stop extra payments during financial difficulty without default risk
- Total interest paid can be substantially reduced if extra payments are consistent
Disadvantages:
- Requires discipline — the flexibility to reduce payments can become a rationalization for not making extras
- The 30-year rate is higher than the 15-year rate, so the baseline cost is higher
- If extra payments are not made consistently, you end up paying the 30-year cost
For borrowers considering this approach, use our amortization calculator to model what extra payment amount would be required to achieve the same payoff timeline as a 15-year loan. You can then evaluate whether you are confident you will maintain that commitment.
Total Interest Comparison at Various Loan Amounts
All rates are illustrative examples. Actual rates vary.
| Loan Amount | 30-Yr Rate | 30-Yr Total Interest | 15-Yr Rate | 15-Yr Total Interest | Savings |
|---|---|---|---|---|---|
| $200,000 | 7.00% | ~$278,900 | 6.50% | ~$113,800 | ~$165,100 |
| $350,000 | 7.00% | ~$488,300 | 6.50% | ~$199,100 | ~$289,200 |
| $500,000 | 7.00% | ~$697,500 | 6.50% | ~$284,400 | ~$413,100 |
| $750,000 | 7.00% | ~$1,046,300 | 6.50% | ~$426,600 | ~$619,700 |
The interest savings scale with loan size. On a $750,000 mortgage, the 15-year loan saves over $619,000 in interest — an extraordinary figure that underscores the power of amortization term.
Other Mortgage Terms: 20-Year and 25-Year
15- and 30-year terms are the most common, but 20-year and 25-year mortgages exist and are available from many lenders. Fannie Mae and Freddie Mac both purchase conforming loans with various amortization terms.
A 20-year mortgage occupies a middle ground: lower payment than a 15-year, significantly less interest than a 30-year. For borrowers who find the 15-year payment too high but want to meaningfully accelerate payoff, a 20-year term is worth modeling.
Which Term Is Right for You?
There is no universal answer — it depends on:
- Income stability: More stable, predictable income supports a higher required payment
- Other financial priorities: High-interest debt, underfunded retirement accounts, and emergency fund gaps typically take precedence over aggressive mortgage paydown
- Career stage: Borrowers early in high-growth careers may benefit from 30-year flexibility; those with peak earning and low remaining debt may prefer 15-year acceleration
- How long you plan to stay: If you plan to sell in 5–7 years, the total interest comparison is less important — the equity buildup rate matters more
- Lender qualification: Your debt-to-income ratio may determine which option is available to you
HUD-approved housing counselors can help you analyze which mortgage structure aligns with your financial position. Their services are often free or low-cost. (HUD)
Use our amortization calculator to compare 15-year and 30-year amortization schedules side by side for your specific loan amount and the current rates you have been quoted. Seeing the full schedule — every month, every balance — is the clearest way to understand what each option actually costs.